
Average response time is the elapsed time between dispatching a job and a technician either acknowledging it or physically arriving on-site, and most field-service teams are slower than they think. Cutting it moves three numbers you actually care about: first-time-fix rate, mean time to resolution, and how many callers turn into paying customers. Contacting a lead within five minutes makes it 21 times more likely to qualify than at 30 minutes, and responding inside one minute can lift conversion by roughly 391%. Yet many contractors still average hours, not minutes.
- Acceptance lag: the gap between dispatch and a tech tapping "accept"
- Arrival lag: the gap between dispatch and boots on the ground
- Why it matters: both numbers feed FTF, MTTR, and whether the customer books with you or the next contractor
Key Takeaways
Average response time, measured as dispatch-to-acknowledge and dispatch-to-arrival, is the single dispatch metric most directly tied to first-time-fix rate, resolution speed, and customer conversion.
| Point | Details |
|---|---|
| Define both clocks | Track dispatch-to-acknowledge and dispatch-to-arrival separately; they drive different outcomes. |
| Automate the callback chain | Manual callback chains cost 12 to 22 minutes; structured accept links cut that to under 90 seconds. |
| Set incremental targets | Move from bottom-quartile to median before chasing top-10% speed benchmarks. |
| Watch technician workload | Cap back-to-back emergency dispatches to avoid burnout as speed improves. |
| Use AI-matched dispatch | Tradepilot pairs GPS-aware routing with skill matching to cut acceptance lag without overloading technicians. |
Table of Contents
- What Does Average Response Time Actually Measure?
- How Do You Calculate Average Response Time?
- What Are Realistic Response Time Benchmarks?
- Why Is Your Average Response Time So High?
- How Can You Reduce Average Response Time?
- How Do You Build a Response Time Dashboard?
- What Does the Research Say About Smarter Routing?
- How Should You Communicate Delays to Customers?
- How Do You Avoid Burning Out Technicians for Speed?
- A Dispatch Manager's Honest Take on Speed Tradeoffs
- Get Faster Response Times Without Burning Out Your Team
- Frequently Asked Questions
- Sources
What Does Average Response Time Actually Measure?
Field-service dispatch splits into two distinct clocks, and conflating them is the most common measurement mistake dispatch managers make. Dispatch-to-acknowledge tracks how long a technician takes to accept or decline a job once it hits their phone. Dispatch-to-arrival tracks the full window until the van is parked at the curb.
Acceptance speed drives customer conversion and callback rates, since a homeowner who books three contractors goes with whoever confirms first. Arrival speed drives first-time-fix and resolution time, because a tech who shows up equipped and briefed on schedule performs better than one rushing in flustered.
- Acceptance lag correlates most tightly with conversion and no-show rates
- Arrival lag correlates most tightly with FTF and MTTR
- Industry benchmark FTF sits at 77%, with top performers reaching 88%
That FTF gap between average and top-tier operators traces back to dispatch discipline as much as technician skill.
How Do You Calculate Average Response Time?
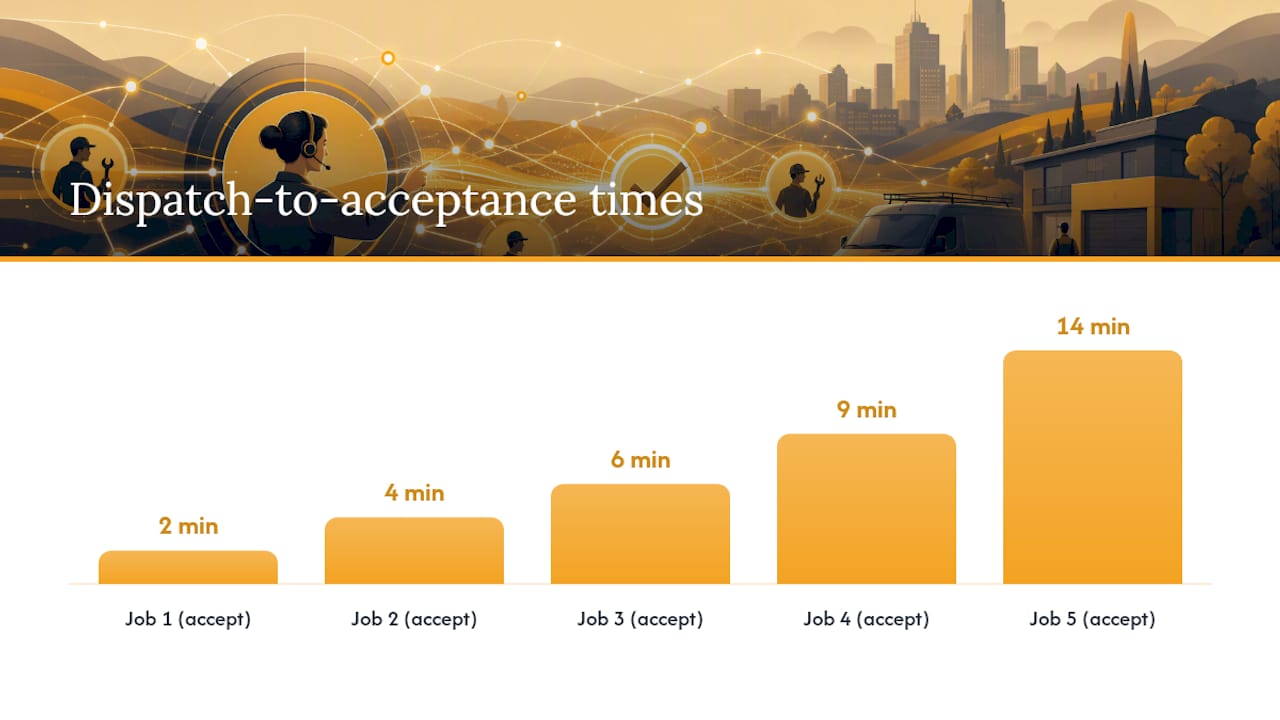
The formula is simple arithmetic, but the discipline is in which timestamps you feed it.
Average acceptance time = sum of (acceptance timestamp minus dispatch timestamp) for all jobs ÷ number of jobs.
Average arrival time = sum of (arrival timestamp minus dispatch timestamp) for all jobs ÷ number of jobs.
Worked example: five HVAC jobs dispatched in a day. Techs accepted at 2, 4, 6, 9, and 14 minutes after dispatch. Add those (35) and divide by five: your average dispatch-to-acknowledge time is 7 minutes. Run the same math on arrival timestamps from your GPS log and you get your arrival-side average.
Pro Tip: Exclude canceled jobs and after-hours emergency calls from your baseline average, or track them as a separate segment. They skew the number and hide the real pattern in your standard workload.
| Data Source | What It Captures |
|---|---|
| Dispatch log | Timestamp when the job was pushed to a technician |
| Technician app | Timestamp when the tech tapped accept or decline |
| GPS/telematics | Timestamp of actual arrival at job-site coordinates |
| Job lifecycle system | Full audit trail for cross-checking discrepancies |
What Are Realistic Response Time Benchmarks?
Trade matters. HVAC crews average roughly 42 minutes to respond, plumbing around 38 minutes, and electrical closer to 55 minutes, with the fastest 10% of operators hitting 4 minutes and the slowest quartile sitting near 180 minutes. That spread is your roadmap: don't aim for 4 minutes on day one.
- Baseline: wherever your trade average sits today
- Achievable: median for your trade within two quarters
- Best-in-class: top-10% territory, worth targeting only after you've closed the median gap
Suparev's percentile data shows incremental target-setting outperforms chasing elite speed too early. Every minute shaved off acceptance time also shaves dollars off lost-revenue risk per call, since slower response windows correlate with lower connect rates and higher abandonment.
Why Is Your Average Response Time So High?
Most slowdowns trace back to one of six repeatable causes, not a mystery.
- Manual callback chains — dispatchers calling techs one by one instead of broadcasting simultaneously
- Technician nonresponse — no acknowledgment mechanism beyond a phone call that goes to voicemail
- Poor routing logic — nearest available tech isn't actually the one assigned
- Skill mismatch — the assigned tech lacks certification for the job, forcing a reassignment mid-dispatch
- Parts unavailability — tech accepts fast but arrival stalls at the supply house
- Fragmented on-call schedules — no clear single point of ownership after hours
Ask yourself: what percentage of jobs require a second dispatch attempt? How often does GPS location differ meaningfully from the scheduled route? Callback chains and nonresponse are urgent, revenue-bleeding problems. Skill mismatch and fragmented scheduling are structural and take longer to fix but pay off longer too.
How Can You Reduce Average Response Time?
Start with the workflow itself before you touch technology. A manual on-call callback chain typically eats 12 to 22 minutes just confirming a technician, before the truck even moves. That's your biggest single lever.
- Automate the acceptance step. Structured accept/decline links delivered by push notification and SMS replace phone tag. Combining SMS with a phone call fallback pushes 90-second response rates to roughly 91%, versus lower rates for single-channel notifications.
- Build GPS-aware routing so the system offers the job to the nearest qualified tech first, not whoever's next on a rotation list.
- Stage parts by job type. Pre-loading common HVAC or plumbing parts onto trucks each morning removes a mid-job supply-house detour.
- Set explicit SLA expectations with technicians: acceptance within 90 seconds, arrival within a defined window per job priority.
- Cross-train for common skill gaps so fewer jobs need reassignment after initial acceptance.
- Adjust incentives so fast, accurate acceptance is rewarded, not just job volume.
Pro Tip: The fastest win most shops overlook is automating that 12 to 22 minute manual callback chain. It's pure dead time, and cutting it to under two minutes usually requires no new headcount, just a structured dispatch flow.
An AI dispatch tool that matches jobs to the best-fit technician by skill, availability, and location removes the guesswork from step two above, and it's worth comparing against manual routing if your dispatcher is still eyeballing a whiteboard.
How Do You Build a Response Time Dashboard?
Measurement only works if it's built into daily operations, not pulled manually once a quarter.
Required telemetry: dispatch timestamp, acknowledge timestamp, arrival timestamp, and GPS ping at arrival. Data quality rule: reject any record missing more than one of those four fields rather than averaging around a gap.
- Display average acceptance time and average arrival time side by side on one dashboard.
- Add acceptance rate, jobs per tech per day, and FTF percentage next to them for context.
- Set an alert threshold, for example anything over 15 minutes unaccepted triggers automatic reassignment to the next available tech.
- Review weekly at the team level, monthly at the individual technician level.
A weekly cadence catches drift before it becomes a quarter of lost revenue. Field-service benchmark research ties this kind of consistent tracking to the gap between 77% and 88% FTF performers.
What Does the Research Say About Smarter Routing?
Academic routing research backs up something dispatch managers already sense intuitively: not every customer or job carries the same cost or urgency, and treating them identically wastes technician time. A Logic-Based Benders Decomposition study modeling technician routing under skill constraints and prioritized visits solved 202 of 210 benchmark instances to optimality, with an average optimality gap of just 6.8%.
Pro Tip: You don't need to run this algorithm yourself. The practical takeaway is to encode priority weights into your own dispatch rules, giving emergency and high-value jobs a routing edge over routine maintenance calls.
How Should You Communicate Delays to Customers?
A slow arrival doesn't have to sour a customer relationship if you handle the wait honestly. Silence is what turns a delay into a lost customer, not the delay itself.
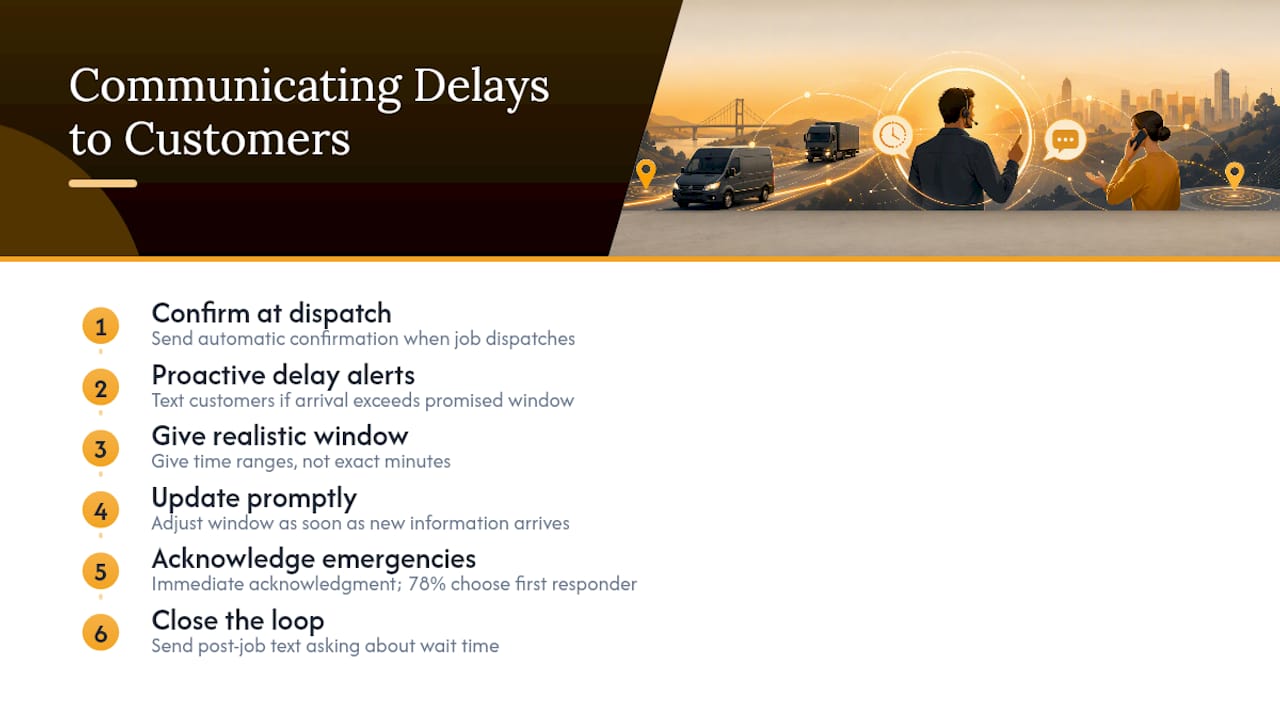
Send an automatic confirmation the moment a job dispatches, so the customer knows someone is coming before they start wondering. If your system flags that arrival will exceed the promised window, trigger a proactive text update rather than waiting for them to call and ask. A message as simple as "Your technician is running about 20 minutes behind due to the previous job. New estimated arrival: 2:40 PM" does more to protect the relationship than a silent 20-minute overage ever will.
Give a realistic window, not a false precise minute. "Between 1 and 3 PM" holds up better than "1:15 PM sharp" when traffic or a complex prior job pushes things back. Train dispatchers to update that window the moment new information arrives, not after the customer calls in frustrated.
For emergency calls, where 78% of customers go with whoever responds first. An immediate acknowledgment matters even more than the eventual arrival time. Confirming "we've got your job, tech is 15 minutes out" beats a faster competitor who never called back.
Finally, close the loop after arrival. A short post-job text asking about the wait time gives you real customer-facing data on how delays are actually landing, separate from your internal dashboard numbers.
How Do You Avoid Burning Out Technicians for Speed?
Chasing response time without watching technician workload backfires within a few months. Techs pushed to accept every job instantly, with no buffer between calls, start declining jobs altogether or leaving.
The fix is capacity-aware dispatching rather than pure speed optimization. Cap the number of back-to-back emergency calls a single tech takes in a shift, and rotate who gets first offer on off-hours jobs instead of always routing to your fastest acceptor. That technician becomes your bottleneck and your flight risk simultaneously.
Track job quality alongside speed. If FTF drops as average response time falls, technicians are rushing rather than genuinely responding faster, and that trade shows up in callback rates within weeks. A first-time-fix tracking system run alongside your response-time dashboard catches this early.
Build in recovery time between high-stress emergency dispatches. A tech who just finished a difficult after-hours call needs a buffer before the next urgent job lands on their phone, even if the dashboard says they're "available." Rotate on-call duty fairly across the team rather than defaulting to whoever answers fastest, since that person otherwise absorbs disproportionate call volume.
Sustainable response-time improvement comes from smarter matching, not from squeezing more out of the same three technicians.
A Dispatch Manager's Honest Take on Speed Tradeoffs
Chasing the fastest possible response time without watching what it costs your team is how you end up with faster numbers and worse retention. Every minute you shave off acceptance time by pushing harder often shows up somewhere else, usually as more windshield time or a tech skipping lunch. The rule of thumb worth following: improve response time in phases, tied to a workload cap, not as an isolated number chased in a vacuum.
Get Faster Response Times Without Burning Out Your Team
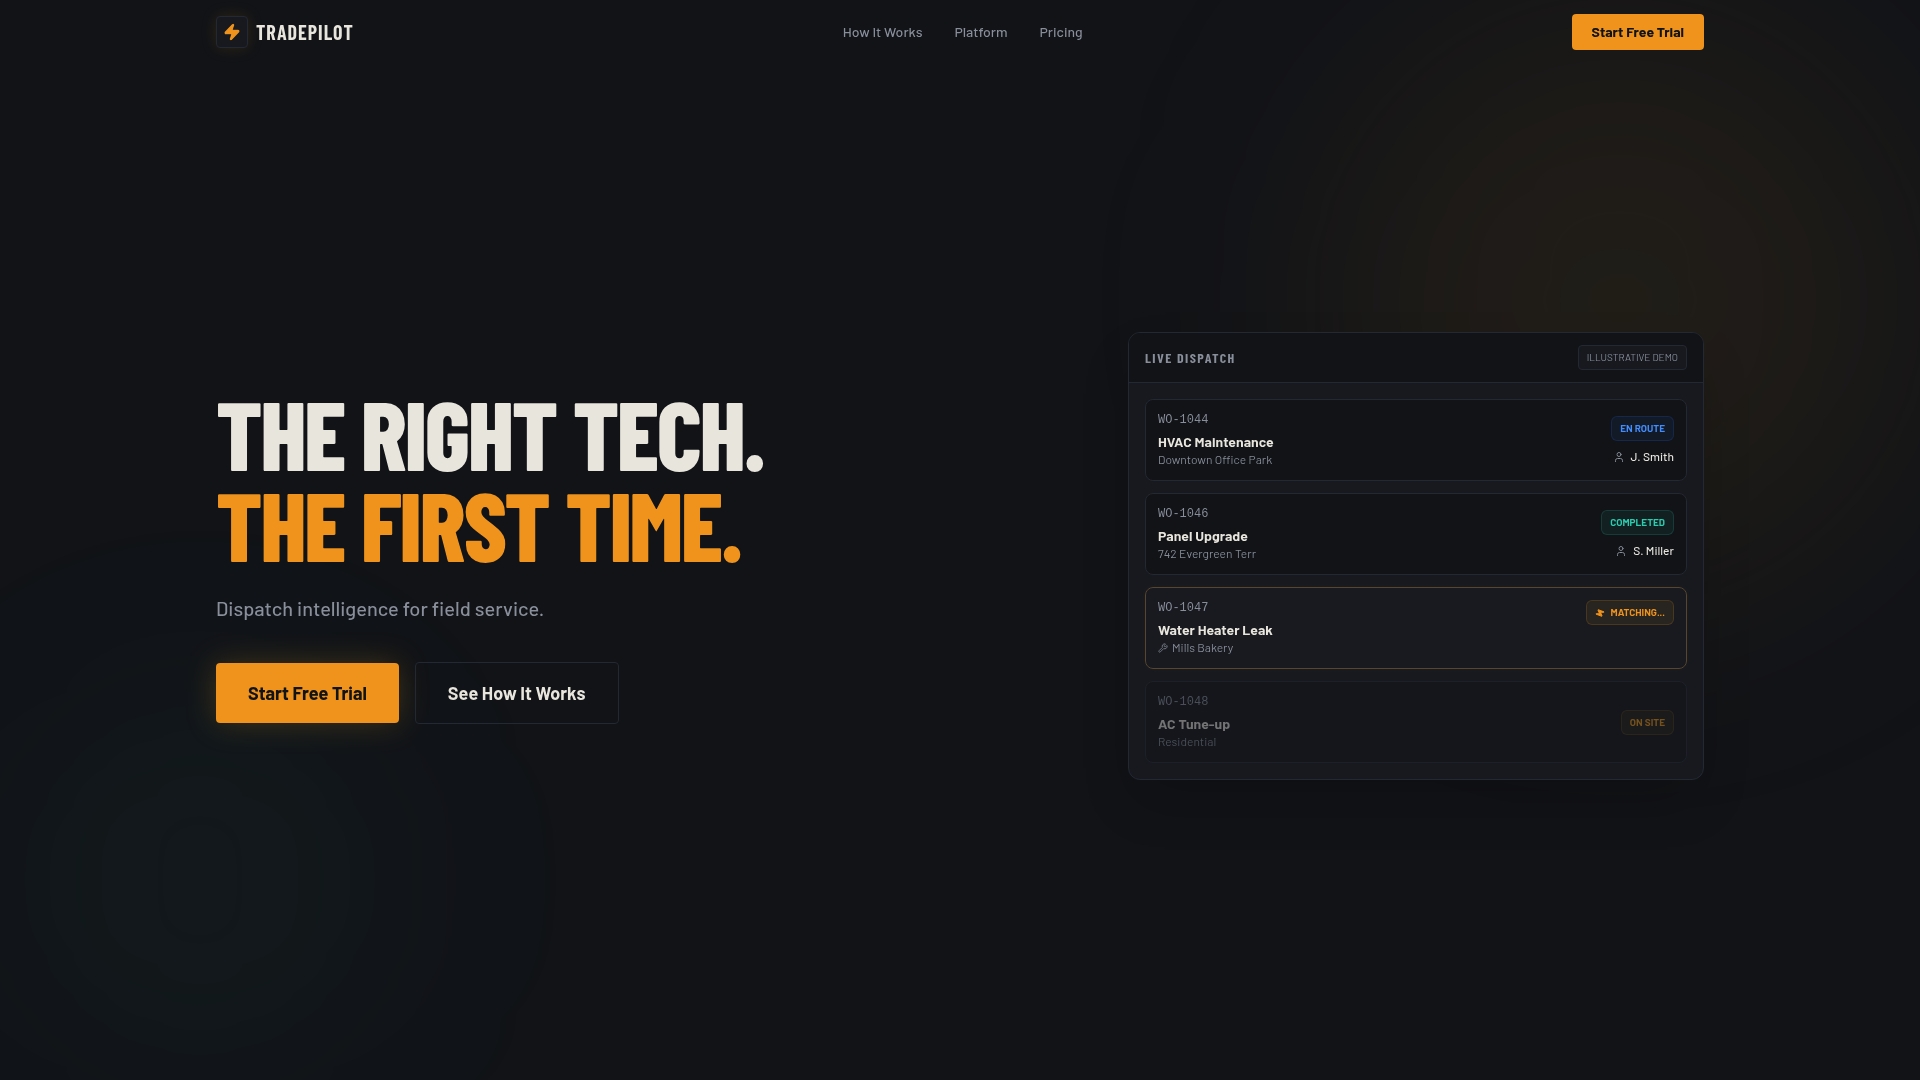
Every tactic above, faster acceptance, GPS-aware routing, priority weighting, structured accept flows, is exactly what Tradepilot's AI dispatch engine does automatically. It matches each job to the best-fit technician by skill, availability, and location in under a second, then tracks acceptance and arrival times on one dashboard alongside FTF and job volume per tech.
Run a 30-day pilot: pick your slowest job category, set a time-to-accept target based on your current baseline, and let Tradepilot's matching handle the routing while you watch the dashboard move. If your dispatcher is still working from a whiteboard or a group text, this is the fastest structural fix available. Start a Tradepilot trial and measure your own before-and-after numbers within the first billing cycle.
Frequently Asked Questions
What is a good average response time for HVAC dispatch?
How do you measure average reply time for technicians? Pull dispatch, acknowledge, and arrival timestamps from your dispatch log, technician app, and GPS telematics, then average the gap between dispatch and each subsequent event.
What's the difference between response time and resolution time? Response time measures how fast a tech accepts or arrives; MTTR measures how long the entire job takes from dispatch to completion, including diagnosis and repair.
Does faster response time always mean better service? Not if it comes at the cost of first-time-fix rate or technician burnout. Track FTF alongside speed to confirm faster dispatch isn't producing rushed jobs.
How often should we review response time metrics? Weekly at the team level catches operational drift early; monthly technician-level reviews work better for coaching and incentive conversations.
Sources
- Response Time Benchmarks | Connect Rates by Speed | Suparev | Suparev
- Cut 40% Response Time: Dispatch Emergency Jobs in 2026
- Aquant 2026 Field Service Benchmark: Companies Can Unlock up to 26% in Service Cost Savings
- Technician routing and scheduling study (CIRRELT technical report)