
Six numbers reliably separate field service teams that improve from teams that stay stuck: first-time fix rate, mean time to repair (MTTR), SLA compliance, technician utilization, average response time, and CSAT. Track those first before adding anything else.
- First-time fix rate
- MTTR
- SLA compliance
- Technician utilization
- Response time
- CSAT
This week, pick three of the six, pull 90 days of history, and write down your current baseline before you change anything.
Key Takeaways
Field service teams improve fastest when they track a small set of well-defined metrics with clean data, not a large dashboard of loosely defined numbers.
| Point | Details |
|---|---|
| Start with six metrics | FTFR, MTTR, SLA compliance, technician utilization, response time, and CSAT cover speed, quality, and operational health. |
| Every KPI needs an owner | A metric without a target and an assigned owner functions as background noise, not a decision tool. |
| Data quality beats data volume | Inconsistent timestamps and manually edited durations corrupt MTTR and utilization calculations more than missing metrics do. |
| Run small experiments | Test one dispatch or staging change at a time with a defined hypothesis and timeframe before scaling it. |
| Unify your data source | Platforms like TradePilot combine dispatch, invoicing, and inventory into one job record, which removes the reconciliation work behind most of these formulas. |
Table of Contents
- What Field Service Metrics and KPIs Actually Mean
- The Four Categories of Field Service KPIs
- Top 10 Field Service Metrics: Formulas, Benchmarks, and Fixes
- How to Choose Which Metrics to Track
- Where Field Service Metrics Data Actually Comes From
- Building Dashboards People Actually Use
- A Simple Playbook for Fixing a Broken KPI
- How Integrated Dispatch and AI Change What You Can Measure
- What Separates Teams That Actually Improve
- Where TradePilot Fits Into Your Measurement Stack
- Frequently Asked Questions
- Sources
What Field Service Metrics and KPIs Actually Mean
A metric is any number you can measure. A KPI is a metric with a target and an owner attached to it. "Average repair time was 74 minutes last month" is a metric. "MTTR should stay under 60 minutes, and the dispatch lead owns that number" is a KPI.
That distinction matters because customer service KPIs split into three functional buckets: speed, quality, and operational health. CSAT and NPS sit in quality. Response time and MTTR sit in speed. SLA compliance sits in operational health. A metric with no target and no owner is just a data point sitting in a report nobody reads.
- Metric: raw measurement, no target attached
- KPI: metric plus a target, an owner, and a review cadence
Pro Tip: Write every KPI definition down in one shared document, including the exact formula and data source. Teams that measure "response time" three different ways can't compare their own numbers month to month, let alone across technicians.
The Four Categories of Field Service KPIs
Group your metrics before you pick them, or you'll end up tracking twelve numbers that all say the same thing. Field service KPIs fall into four buckets:
- Operational — how fast and efficiently work gets done (response time, utilization, travel time)
- Customer — how the customer experienced the visit (CSAT, NPS, repeat complaints)
- Financial — how the work affects the bottom line (cost per job, revenue per technician)
- Quality — whether the job actually got fixed (first-time fix rate, rework rate)
A field service KPI framework works best when it balances customer outcomes, operational execution, and business goals rather than leaning entirely on one category. A company just getting organized should lean operational and quality first, since those numbers expose the process failures driving everything else. A company with clean operations can afford to chase financial and customer-loyalty metrics instead. First-time fix rate maps directly to lower cost per job. CSAT maps directly to renewal and referral rates. Pick metrics because they connect to a decision you're actually going to make.
Top 10 Field Service Metrics: Formulas, Benchmarks, and Fixes
1. First-Time Fix Rate (FTFR)
Formula: (Jobs completed on first visit ÷ total jobs) × 100.
FTFR is the single number that moves operating cost the most in a typical field service operation, because every repeat visit costs you a truck roll, a technician's time, and often a frustrated customer. Data comes from your dispatch or field service management (FSM) system, tagged by job completion status. Top performers often land in a high percentage range, but the right target depends heavily on trade complexity. Electrical fault-finding will always run lower than routine HVAC filter swaps.
To improve it: build a parts-staging process so technicians roll with the right inventory, maintain a skills matrix so the right tech gets dispatched the first time, and review your first-time fix rate trend by technician, not just company-wide.
2. Mean Time to Repair (MTTR)
Formula: Total repair time ÷ number of repairs, measured from arrival to job completion.
MTTR data comes from job timestamps in your FSM platform. PagerDuty's service performance framework treats MTTR alongside mean time to acknowledge (MTTA) as core response metrics, and the same logic applies to field trades: how fast you acknowledge a job matters almost as much as how fast you finish it. Improve MTTR with better diagnostic checklists, pre-loaded technician tablets with equipment manuals, and tighter parts availability.
3. Average Response Time
Formula: Time from customer request to technician arrival (or first acknowledgment), averaged across jobs.
This pulls from dispatch timestamps and GPS/telematics data. Response time is where SLA breaches usually start, so tightening dispatch logic (matching the closest qualified technician, not just the next one in queue) is often the fastest lever you have.
4. Mean Time to Completion
Formula: Time from job assignment to job closure, including travel and repair.
This is broader than MTTR because it captures scheduling delays, not just wrench time. If this number is high but MTTR is fine, your bottleneck is dispatch and scheduling, not technician skill.
5. Technician Utilization
Formula: (Billable hours ÷ total available hours) × 100.
Data comes from time entry combined with job records. A common target range is a moderate to high utilization level. Above that, technicians burn out and rework climbs; below it, you're overstaffed or your routing is inefficient. Improve it with tighter route clustering and by trimming administrative time with mobile invoicing.
6. Travel Time and Cost
Formula: Total travel hours (or miles) per job, and fuel/vehicle cost per job.
Telematics and GPS integration are the primary data source here. High travel time usually means poor geographic clustering of jobs. AI-assisted dispatch that groups jobs by zone rather than by call order can cut this meaningfully.
7. Repeat Visits and Rework Rate
Formula: (Jobs requiring a second visit for the same issue ÷ total jobs) × 100.
This is the inverse signal to FTFR and one of the easiest metrics to game if your denominator is loose. Make sure "same issue" is defined consistently, or technicians will code repeat visits as new jobs to protect their numbers.
8. Jobs Per Day (or Per Technician)
Formula: Total completed jobs ÷ number of active technician days.
Useful for capacity planning, but dangerous in isolation. A technician squeezing in extra jobs by rushing diagnostics will tank your FTFR and rework rate. Always pair this metric with a quality metric.
9. SLA Compliance
Formula: (Jobs meeting SLA terms ÷ total contracted jobs) × 100.
SLA data usually lives in your CRM or contract management module, cross-referenced against dispatch timestamps. Salesforce recommends measuring operational metrics like this daily, since SLA breaches compound fast if caught late. A miss rate creeping above a few percent in any 24-hour window is worth an alert, not a monthly review.
10. Customer Satisfaction (CSAT), NPS, and CES
Formula: CSAT is typically the average of post-job survey scores (often 1 to 5). NPS asks a single "likelihood to recommend" question scored 0 to 10 and nets promoters minus detractors. Customer Effort Score (CES) asks how easy the interaction was.
These three answer different questions: CSAT measures satisfaction with this visit, NPS measures loyalty, and CES measures friction. Automating survey collection right after job closure dramatically improves response rates compared to manual follow-up calls.
Quick benchmark callout: Field service KPI research consistently names first-time fix rate, response time, utilization, and SLA compliance as the metrics most tightly linked to both customer retention and cost control, which is why they anchor almost every mature dashboard.
How to Choose Which Metrics to Track
- Tie every candidate metric to a specific decision you'd make differently based on it.
- Assign an owner. A metric nobody's accountable for won't move.
- Confirm you can actually measure it cleanly with your current systems before committing to it.
- Cut the list down to the fewest metrics that still drive action. Five to seven is a realistic ceiling for most teams.
Starter sets by maturity:
- Foundational: FTFR, response time, jobs per day, CSAT
- Growth: add MTTR, SLA compliance, technician utilization
- Advanced: add travel cost per job, rework rate, NPS, revenue per technician
Watch for dashboard smells: more than ten KPIs on one screen, metrics with denominators that shift month to month, or incentive structures that reward speed at the expense of quality. If your team is closing jobs faster but rework is climbing, that's not progress. It's a metric being gamed.
Where Field Service Metrics Data Actually Comes From
Most of your metrics pull from five systems: the FSM/dispatch platform, telematics or GPS, time entry, parts and inventory records, and CRM or customer survey tools. The trick isn't collecting more data. It's getting these systems to agree on the same job ID, technician ID, and timestamp format so a report doesn't quietly double count a visit.
A workable schema needs, at minimum: job ID, technician ID, scheduled time, arrival time, completion time, parts used, and survey score, all tied to one canonical job record.
- Inconsistent timezones between GPS and dispatch systems will quietly corrupt response-time calculations
- Manually edited durations (technicians rounding hours) distort MTTR and utilization
- Missing timestamps on canceled or rescheduled jobs skew every rate that uses job count as a denominator
Pro Tip: Before trusting any new KPI, pull 20 random job records and manually verify the timestamps against what actually happened. Bad data dressed up in a clean dashboard is worse than no dashboard at all.
Building Dashboards People Actually Use
Different roles need different slices of the same data. An executive summary should show trend lines on the four or five KPIs tied to strategic goals. An operations board needs today's dispatch status and SLA risk. Technician-level views should show individual FTFR and CSAT so people can see their own trend, not just the team average.
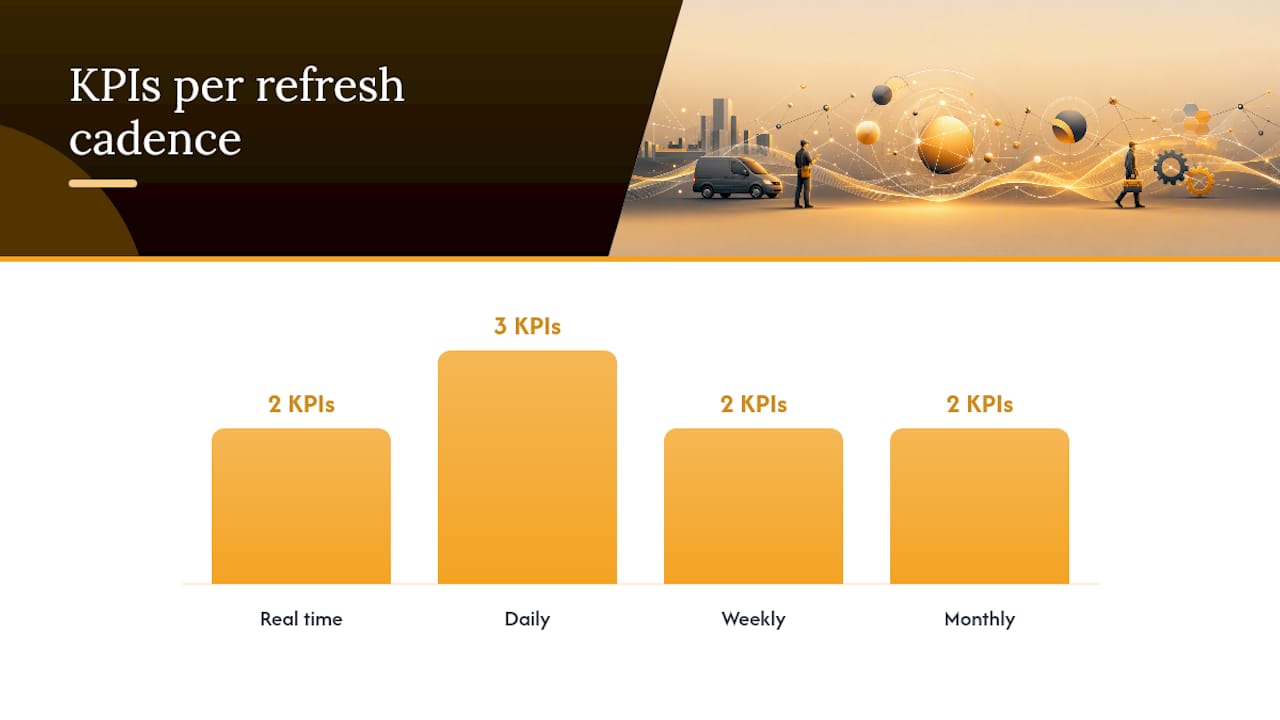
Refresh cadence should match how fast the number can actually change and how fast someone needs to act on it.
| KPI type | Refresh cadence | Why |
|---|---|---|
| Dispatch status, SLA risk | Real time | Missed jobs need same-day intervention |
| Response time, FTFR, utilization | Daily | Operational metrics shift day to day |
| CSAT, NPS trends | Weekly | Survey volume needs time to accumulate |
| Cost per job, revenue per tech | Monthly | Strategic metrics move slowly and need context |
Set alert thresholds that trigger action, not noise. If SLA miss rate exceeds a set percentage within 24 hours, that should page the dispatch lead directly, not wait for the weekly report.
A Simple Playbook for Fixing a Broken KPI
When FTFR drops, check parts availability first, then technician skill match, then whether diagnostic time was rushed. When MTTR rises, check whether it's a specific technician, a specific job type, or a system-wide dispatch delay.
- Diagnose: pull the last 30 days of the affected metric segmented by technician, job type, and region.
- Intervene: pick the single most likely root cause and design one change to test against it.
- Measure: run the change for a defined window and compare against baseline.
Two examples: raising FTFR by pre-staging common parts based on job type history, or cutting travel time by clustering jobs geographically instead of dispatching by call order.
Use a lightweight experiment structure for any change: state the hypothesis, pick one metric to move, set a timeframe (two to four weeks is usually enough for field service volume), and define success before you start, not after you see the results.
How Integrated Dispatch and AI Change What You Can Measure
Metrics are only as good as the system generating them. When dispatch, invoicing, and inventory live in separate tools, timestamps drift and job records fragment across systems, which corrupts almost every formula above.
- AI-based job-to-technician matching improves schedule density, which shows up directly in utilization and response-time numbers
- Unified invoicing and inventory close the gap between "job marked complete" and "parts actually billed," reducing revenue leakage that never shows up in a fragmented system
When evaluating any field service software for measurement purposes, check four things: whether data is exportable without a support ticket, whether the platform has an API for your CRM or accounting tools, whether survey collection is automated post-job, and how fast dispatch decisions actually get made. Tools built for AI-driven dispatch tend to close that measurement gap faster than legacy scheduling boards.
What Separates Teams That Actually Improve
I've noticed the operations leaders who move their numbers share a few habits: they run a fifteen-minute weekly KPI huddle instead of a monthly deep dive, every metric has one named owner, and they run small experiments constantly instead of overhauling the whole process at once.
They also keep the KPI list short and revisit it every quarter, and they treat a metric win as a team event, not just a line on a report. Pairing a struggling technician with a strong dispatcher for a week does more for FTFR than another training slide deck ever will.
Where TradePilot Fits Into Your Measurement Stack
Most of the measurement problems in this guide (fragmented timestamps, manual survey follow-up, dispatch guesswork) come from running separate tools that were never built to share data. TradePilot is built as one system instead: dispatch, invoicing, inventory, and analytics all pull from the same job record, so the metrics above are accurate by default instead of something you reconcile at month end.
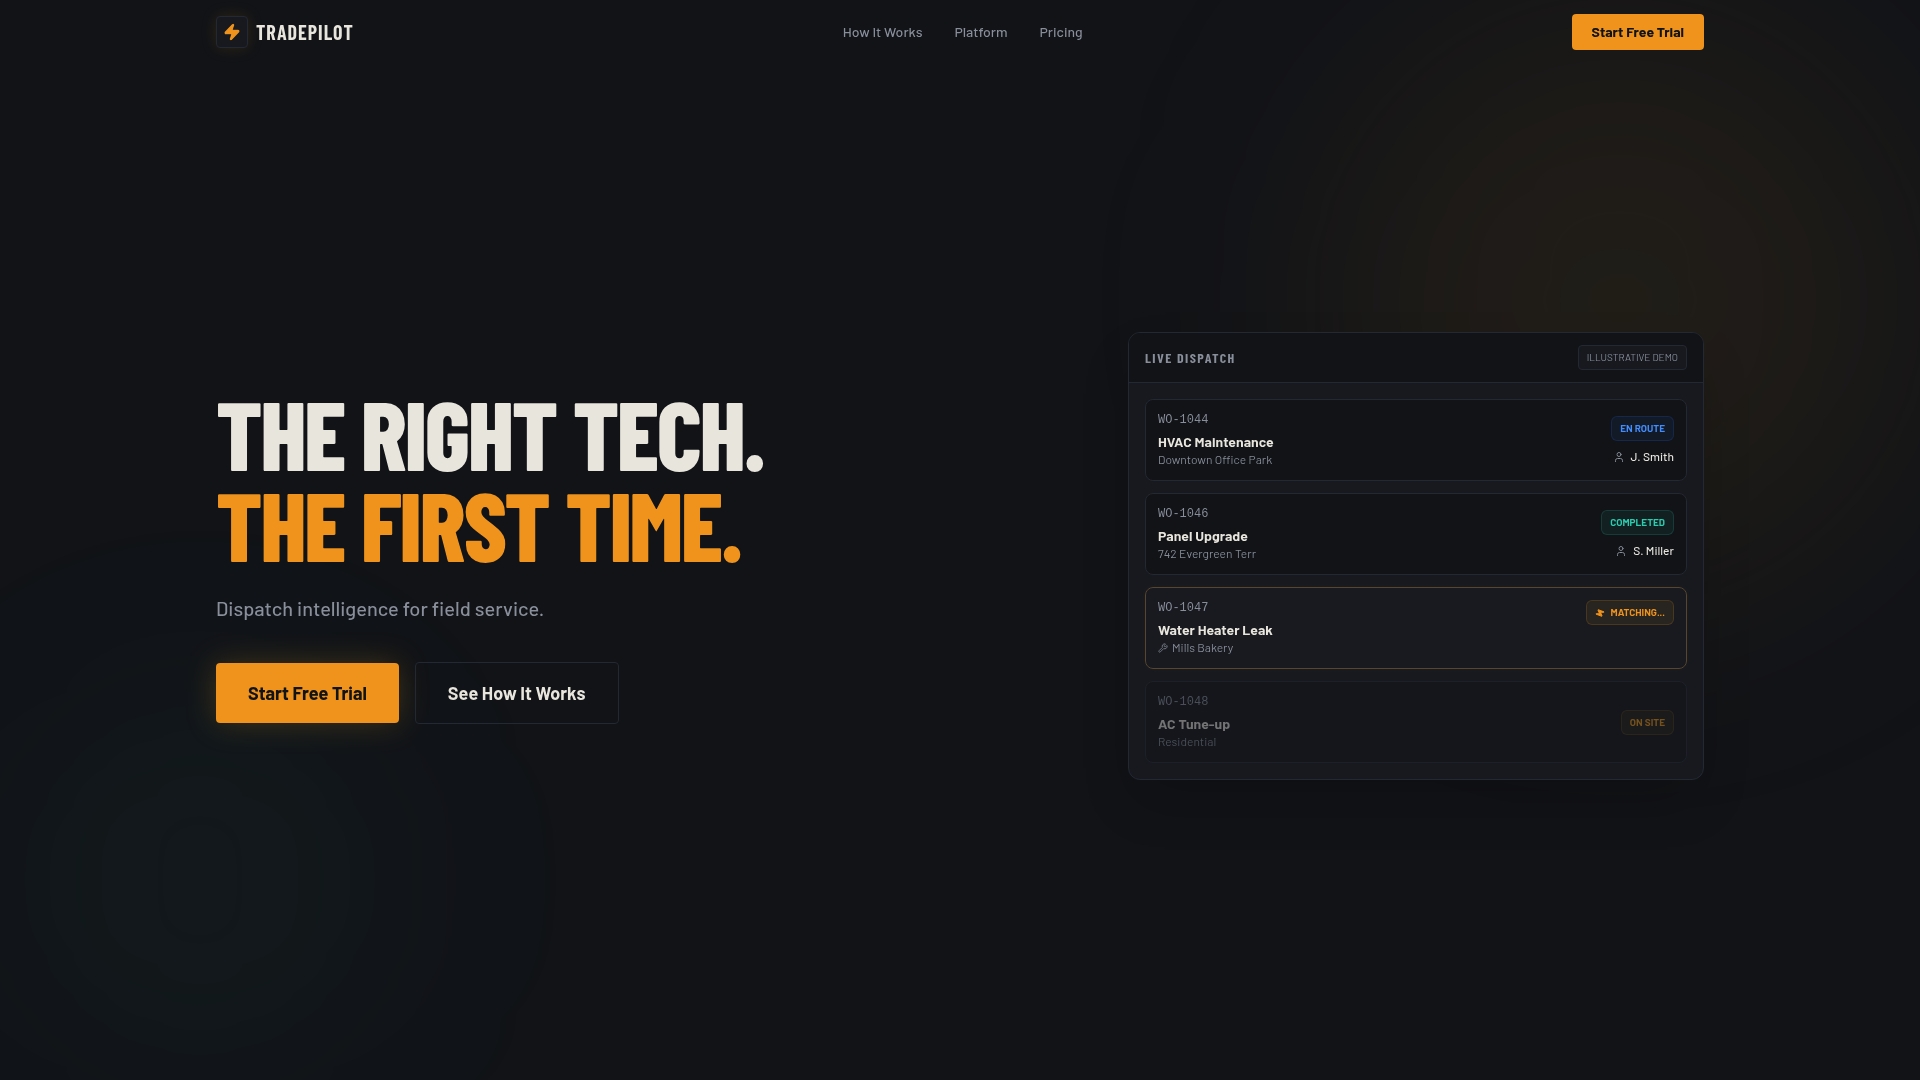
Three things matter most for KPI tracking specifically: unified data across every job so FTFR and MTTR calculations don't require manual cleanup, AI-based dispatch that matches the right technician by skill and location in under a second, and built-in reporting with alerts so an SLA risk reaches the right person the same day it happens, not the following week. If you're managing HVAC, electrical, or plumbing technicians and tired of stitching together spreadsheets to get a straight answer on utilization or response time, start a TradePilot trial and see your first dashboard populate from real job data within a day.
Frequently Asked Questions
What is the difference between a field service metric and a KPI?
A metric is any measurable data point, like average job duration. A KPI is a metric with a target and an owner attached, used to guide a specific business decision.
What is a good first-time fix rate?
Top-performing field service operations often land between 75 and 90 percent, though the realistic target depends on trade complexity. Diagnostic-heavy electrical work will run lower than routine maintenance visits.
How often should field service KPIs be reviewed?
Operational metrics like response time and SLA compliance should be checked daily. Experience metrics like CSAT work well on a weekly cadence, while strategic financial metrics are better reviewed monthly.
What causes inaccurate field service metrics?
Inconsistent timezones between GPS and dispatch data, manually edited job durations, and missing timestamps on canceled jobs are the most common causes of skewed KPI calculations.
Which field service metric has the biggest impact on cost?
First-time fix rate typically has the largest effect on operating cost, since every repeat visit adds a truck roll, technician hours, and often a dissatisfied customer.
Sources
- 12 Customer Service KPIs Every Service Team Should Measure | Salesforce
- Service Performance insights | PagerDuty Documentation
- A refresher on A/B testing | Harvard Business Review