
A reorder point (ROP) is the on-hand inventory level that triggers a replenishment order, calculated as (average daily usage × lead time in days) + safety stock. That single formula, paired with reliable inputs, is what separates data-driven replenishment from reactive panic-buying. The Smart Inventory Control Guide pairs ROP directly with EOQ as the two core levers of inventory control.
Three things to do right now:
- Pick one high-priority SKU and run the formula with your last 90 days of usage data.
- Set a low-stock alert in your inventory system at the calculated ROP level.
- Pull your last three purchase orders for that SKU and log the actual order-to-receipt days as your lead time input.
The sections below cover how to measure each input accurately, two worked examples, safety-stock methods including the statistical z-score approach, common mistakes, and how to implement ROPs in software.
Key Takeaways
Setting accurate inventory reorder points requires reliable inputs, a consistent review cadence, and automation that connects consumption to replenishment without manual intervention.
| Point | Details |
|---|---|
| Core ROP formula | ROP = (average daily usage × lead time in days) + safety stock — the foundation of every calculation. |
| Safety stock method | Use days-of-supply for low-variability consumables; use the z-score method for critical or high-value parts. |
| Input accuracy | Measure ADU from a 90-day rolling window and lead time from actual PO history, not supplier quotes. |
| Review cadence | Recalculate ROPs quarterly at minimum; recalculate immediately after supplier changes or demand shifts. |
| Tradepilot | Tradepilot automates low-stock alerts and links work-order consumption to inventory thresholds in real time. |
Table of Contents
- What are inventory reorder points, and when should you use them?
- Why reorder points matter for your bottom line
- How does the reorder point formula work?
- How to calculate your reorder point: two worked examples
- Which safety-stock method should you use?
- How to measure usage and lead time accurately
- What replenishment strategy fits your operation?
- How to implement reorder points in your inventory system
- Field-service businesses need a different approach to reorder points
- The part most operations get wrong
- Tradepilot connects inventory thresholds directly to your dispatch workflow
- Sources
What are inventory reorder points, and when should you use them?
A reorder point is the inventory level at which you place a new order so that replenishment stock arrives before you run out. It is a trigger, not an order quantity. When on-hand units hit the ROP, the system (or the manager) initiates a purchase order. The order quantity itself is a separate decision, often set by EOQ or a min-max policy.
When ROP works well:
- Fast-moving consumables with predictable daily usage (refrigerant, wire nuts, PVC fittings)
- Critical spare parts where a stockout stops a job (capacitors, contactors, circuit breakers)
- Multi-site stocking where each location needs its own trigger based on local usage and lead time
When a simple ROP is not enough:
- Items with highly lumpy demand driven by large, infrequent projects (a VFD board ordered once a quarter)
- Perishable or shelf-life-constrained materials where time-based ordering makes more sense
- Situations where a supplier requires minimum order quantities that override the trigger logic
ROP is often confused with related terms. A min-max policy uses ROP as the "min" (the trigger) and a separate "max" as the target stock level after replenishment. In EOQ contexts, ROP tells you when to order while EOQ tells you how much. Distribution Requirements Planning (DRP) is a network-level approach that coordinates ROPs across multiple stocking locations, which is a step up in complexity from a single-location ROP.
Why reorder points matter for your bottom line
Getting your reorder level calculation right directly affects two competing costs: the cost of carrying too much stock and the cost of running out.
The cost trade-offs:
- Carrying cost covers capital tied up in inventory, storage space, insurance, and obsolescence risk. Setting your ROP too high inflates this.
- Stockout cost includes emergency freight, expedited supplier fees, lost revenue, and the labor cost of a technician sitting idle waiting for a part. Setting your ROP too low creates this.
- Ordering cost is the administrative and transaction cost per purchase order. Ordering too frequently (from a low ROP with small safety stock) drives this up.
- Customer and service impact is harder to quantify but real: a missed service window because a part was out of stock damages the relationship and can cost a contract renewal.
Lead time is the variable that most managers underestimate. If your supplier takes a week to deliver and you only have a few days of stock left when you order, you will stock out every time. The ROP formula builds lead time directly into the trigger so the order is placed early enough for stock to arrive before you hit zero. Supplier reliability matters just as much as average lead time: a supplier who sometimes takes 14 days when the average is 7 days requires a higher buffer than the average alone would suggest.
How does the reorder point formula work?
The canonical formula, as documented in both the inFlow inventory guide and the Wikipedia entry on reorder points, is:
ROP = (Average Daily Usage × Lead Time in Days) + Safety Stock
For operations with measurable demand variability, the expanded statistical form adds precision:
ROP = (ADU × L) + Z × √(L × σ_d² + ADU² × σ_L²)
Where:
| Variable | Meaning | How to measure it |
|---|---|---|
| ADU | Average daily usage (units/day) | Total units consumed ÷ days in the window (use 90 days for most SKUs) |
| L | Lead time in days | Average order-to-receipt days from PO history (last 5–10 POs) |
| Z | Z-score for chosen service level | 1.65 for 95% |
| σ_d | Standard deviation of daily demand | Calculated from daily usage data over the same window as ADU |
| σ_L | Standard deviation of lead time | Calculated from PO history |
| SS | Safety stock | Calculated separately (see next section) |
Measurement guidance for each input:
Use a 90-day rolling window for ADU on fast-moving parts. For seasonal items (think furnace filters in October or AC capacitors in June), use the ADU from the same season last year rather than an annual average. For lead time, pull actual order-to-receipt dates from your PO history, not the supplier's quoted lead time, which is often optimistic. If you have pre-booked jobs that will consume specific parts, add that committed demand to your ADU calculation for the relevant period.
The NC State SCM tutorial on reorder point formulas provides a thorough derivation of both the basic and statistical forms if you want the underlying math.
How to calculate your reorder point: two worked examples
Example 1: Simple ROP without safety stock
Your shop uses 10 capacitors per day on average. Your supplier takes 5 days to deliver.
- Identify ADU: 10 units/day
- Identify lead time: 5 days
- Apply the formula: ROP = 10 × 5 = 50 units
- When on-hand stock hits 50 capacitors, place the order.
No safety stock is included here. This works only if demand and lead time are both consistent. One bad week and you stock out.
Example 2: ROP with safety stock
Same capacitor, but now you want a buffer. Using the simple days-of-supply safety-stock method:
- Max daily usage: your busiest observed day
- Max lead time: 8 days (your supplier's worst observed delivery)
- Average daily usage: 10 units/day
- Average lead time: 5 days
- Safety stock = (15 × 8) − (10 × 5) = 120 − 50 = 70 units
- ROP = (10 × 5) + 70 = 120 units
That 70-unit buffer covers you if demand spikes or the supplier runs late simultaneously. The inFlow guide on determining reorder points walks through this same calculation step by step.
Spreadsheet checklist (copy into Excel or Google Sheets):
- Column A: SKU name
- Column B: ADU (total units / days in window)
- Column C: Lead time in days (from PO history)
- Column D: Max daily usage
- Column E: Max lead time
- Column F: Safety stock = (D × E) − (B × C)
- Column G: ROP = (B × C) + F
Pro Tip: Use conditional formatting in Excel to highlight any row where current on-hand stock is at or below the ROP value in column G. Microsoft's conditional formatting guide shows exactly how to set this up for small shops not yet on dedicated inventory software.
Which safety-stock method should you use?
Both the days-of-supply method and the statistical z-score method are valid. The right choice depends on how much data you have and how much variability you face.
| Method | Formula | Best for | Limitation |
|---|---|---|---|
| Days-of-supply | (Max daily sales × Max lead time) − (Avg daily sales × Avg lead time) | Low-variability, fast-moving SKUs; quick setup | Overestimates buffer when max values are outliers |
| Statistical (z-score) | Z × √(L × σ_d² + ADU² × σ_L²) | High-value or critical parts with measurable variability | Requires standard deviation data; more setup time |
Days-of-supply in practice: If your max daily usage and max lead time are not wild outliers, this method is fast and good enough for most consumables. The capacitor example above used it.
Statistical method in practice: Suppose your daily demand for a contactor has a standard deviation (σ_d) of 3 units, your average lead time is 7 days with a standard deviation (σ_L) of 1.5 days, and your ADU is 5 units/day.
Safety stock = 1.65 × √(7 × 9 + 25 × 2.25) = 1.65 × √(63 + 56.25) = 1.65 × √119.25 ≈ 1.65 × 10.92 ≈ 18 units
That is a tighter, more defensible buffer than the days-of-supply method would give for the same SKU if the max values were inflated by one unusual week.
Align the service level to the actual cost of a stockout, not to a round number someone picked years ago.
How to measure usage and lead time accurately
Garbage in, garbage out. The formula is only as good as the inputs.
Measuring average daily usage:
- Pull consumption data from your inventory system or work orders for the last 90 days.
- Exclude one-off demand spikes caused by a single large job unless that job type recurs regularly.
- Treat returns and cancellations as negative consumption and net them out before calculating ADU.
- For project-driven demand, use a rolling 90-day window tied to your work-order consumption data rather than a static annual average. This is especially relevant for HVAC parts with seasonal demand patterns, as HVAC parts reorder modeling guidance recommends.
Measuring lead time:
- Use actual order-to-receipt dates from your last 5–10 POs per supplier, not the quoted lead time.
- If a supplier's lead time has changed recently (new warehouse, shipping disruption), weight recent POs more heavily or reset the window to the last 60 days.
- For single-source critical parts with no substitute, use the maximum observed lead time, not the average.
Common mistakes checklist:
- Set-and-forget: ROPs drift as demand and lead times change. Practitioners recommend reviewing and adjusting reorder points quarterly at minimum.
- Stale lead-time estimates: Using a supplier's quoted lead time from two years ago when actual delivery now takes twice as long.
- Ignoring demand variability: Trades businesses face big-job spikes that can double weekly usage overnight. Failing to account for this is one of the most common pitfalls in field-service inventory.
- Mixing unit types: Calculating ADU in boxes but entering lead time for individual units, or vice versa.
- Using annual averages for seasonal items: A single annual ADU for furnace filters will understock you in fall and overstock you in spring.
Pro Tip: Set a calendar reminder to recalculate ROPs every quarter, and immediately after any supplier change, major contract win, or seasonal transition. Quarterly review catches most of the drift before it causes a stockout or excess.
What replenishment strategy fits your operation?
The reorder point is a trigger. The strategy around it determines how you respond when that trigger fires.
Continuous review monitors on-hand inventory in real time and places an order the moment stock hits the ROP. This is the right approach for critical or high-value SKUs where a stockout is expensive. It requires real-time inventory data, which means either a good inventory system or disciplined manual counts.
Periodic review checks inventory on a fixed schedule (weekly, monthly) and orders if stock is below a target level. It is simpler to manage for low-touch items but means you might not catch a dip until the next review date. Combining it with a minimum stock level (a floor) gives you a safety net between reviews.
Min-max sets a minimum (the ROP) and a maximum (the target after replenishment). When stock hits the min, you order up to the max. This pairs naturally with ROP and is the most common policy in field-service parts rooms. The Amazon Business inventory control guide describes how ROP and EOQ work together: ROP triggers the order, EOQ or a fixed order quantity determines how much to order.
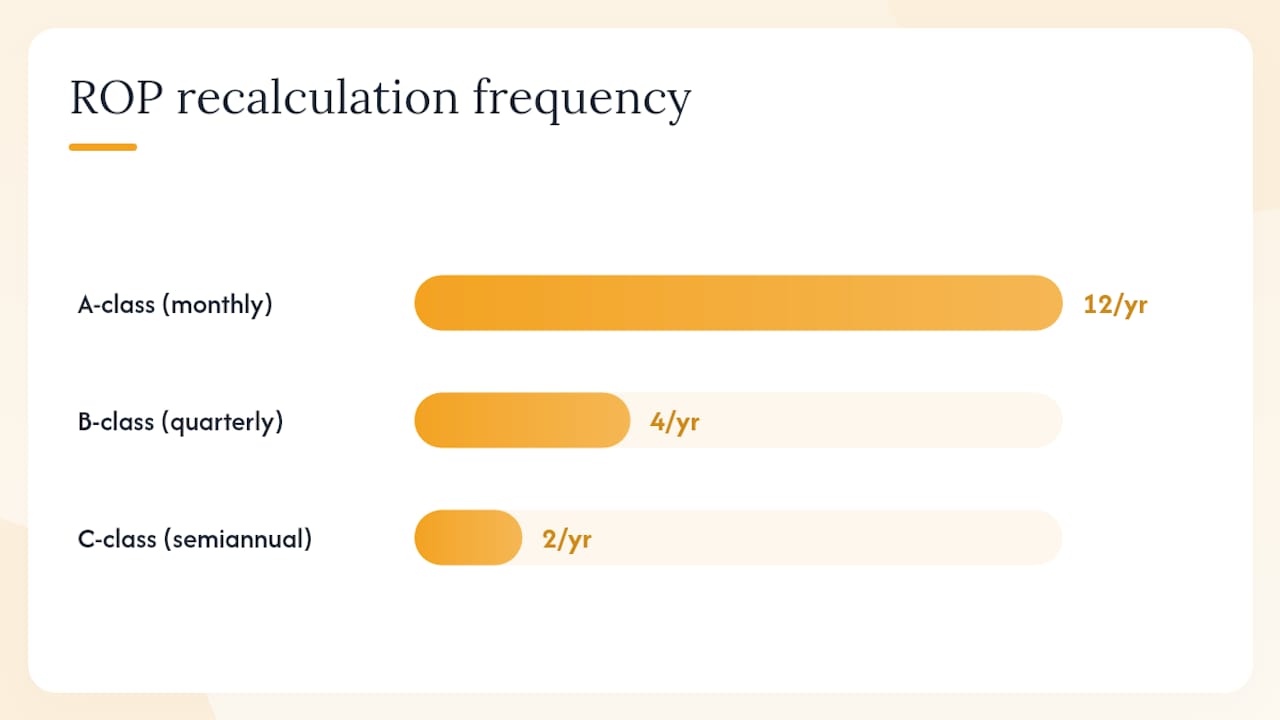
ABC segmentation and review frequency:
- A-class (high value, high criticality): Continuous review, monthly ROP recalculation, statistical safety stock.
- B-class (moderate value/usage): Continuous or periodic review, quarterly recalculation, days-of-supply safety stock.
- C-class (low value, high volume consumables): Periodic review, semiannual recalculation, simple fixed buffer.
Pairing inventory cycle counting with your ROP review schedule keeps your on-hand figures accurate enough to trust the trigger.
How to implement reorder points in your inventory system
Moving from a spreadsheet to an automated system is where ROPs go from a calculation exercise to an operational habit.
Implementation checklist:
- Enter each SKU with its ROP value, safety stock quantity, and preferred supplier.
- Map lead time per supplier (not per SKU category) so the system can flag when a supplier's actual lead time diverges from the stored value.
- Set a low-stock alert that fires when on-hand quantity reaches the ROP level, not after it drops below.
- Configure who receives the alert: the purchasing manager, the warehouse lead, or both.
Automation examples:
- Automatic PO draft: When stock hits the ROP, the system creates a draft purchase order for the EOQ or min-max order quantity, ready for one-click approval.
- Email or SMS to vendor: Platforms like Shopify Flow demonstrate how low-stock triggers can send vendor emails and create reorder workflows automatically, reducing the manual step entirely.
- Work-order integration: Link part consumption from closed work orders back to on-hand inventory in real time so the ROP trigger reflects actual usage, not just periodic counts.
- Slack or email notifications: Internal alerts to the dispatch team when a critical spare is approaching the ROP, so they can factor availability into scheduling.
For small shops not yet on dedicated software, Excel with conditional formatting (highlight cells where on-hand ≤ ROP) is a workable first step. Predictive tools and AI-driven demand feeds can go further, adjusting ROP thresholds dynamically as demand patterns shift rather than waiting for a quarterly manual review.
Field-service businesses need a different approach to reorder points
HVAC, electrical, and plumbing businesses face a demand pattern that generic inventory guides ignore: consumption is driven by jobs, not by steady daily sales. A single large commercial job can consume a month's worth of a specific part in a week.

The core rule: Treat critical spares differently from consumables. For a single-source part with no substitute (a specific VFD board, a proprietary control module), use the maximum observed lead time in your ROP calculation, not the average. The cost of being wrong once outweighs the carrying cost of the extra buffer.
Field-service segmentation:
- Vital parts (technician cannot complete the job without them, no substitute available): Use max lead time, 95–98% service level, monthly review. Examples: specific motor starters, OEM control boards.
- Essential parts (job is delayed but workaround exists): Use average lead time plus one standard deviation, 90–95% service level, quarterly review. Examples: standard capacitors, contactors, common fittings.
- Consumable parts (low cost, widely available): Days-of-supply safety stock, 90% service level, semiannual review. Examples: wire nuts, PVC cement, Schrader valve cores.
Connect work-order consumption directly to your ROP inputs. When a technician closes a job and parts are logged against it, that consumption should update your rolling ADU automatically. Using rolling 90-day windows tied to work-order data gives you a far more accurate ADU than any static annual figure, particularly for seasonal parts. The AI dispatching integration that links job assignments to parts consumption is exactly the kind of closed loop that makes this work in practice.
The part most operations get wrong
The math in this guide is not complicated. The failure mode is almost never the formula. It is treating the ROP as a one-time setup rather than a living parameter.
Most businesses calculate their reorder points once, enter them into a system, and then watch them slowly become wrong as demand shifts, suppliers change, and lead times drift. A reorder point set in January based on last year's usage will be off by spring if you picked up two new service contracts in February.
The practical fix is simple: start with your A-class SKUs, get those ROPs right, automate the alerts, and then expand. Do not try to model every SKU at once. A well-maintained ROP on your 20 most critical parts delivers more value than a poorly maintained one across 500 line items. Quarterly recalculation is the minimum cadence; after any significant demand change, recalculate immediately. Treat the ROP as a forecast, not a setting.
Tradepilot connects inventory thresholds directly to your dispatch workflow
Field-service businesses that run inventory, dispatch, and work orders on separate systems end up with a gap between what was consumed on a job and what gets reordered. Tradepilot closes that gap. The platform tracks parts consumption from closed work orders, updates on-hand quantities in real time, and fires low-stock alerts the moment a SKU hits its threshold — no manual count required.
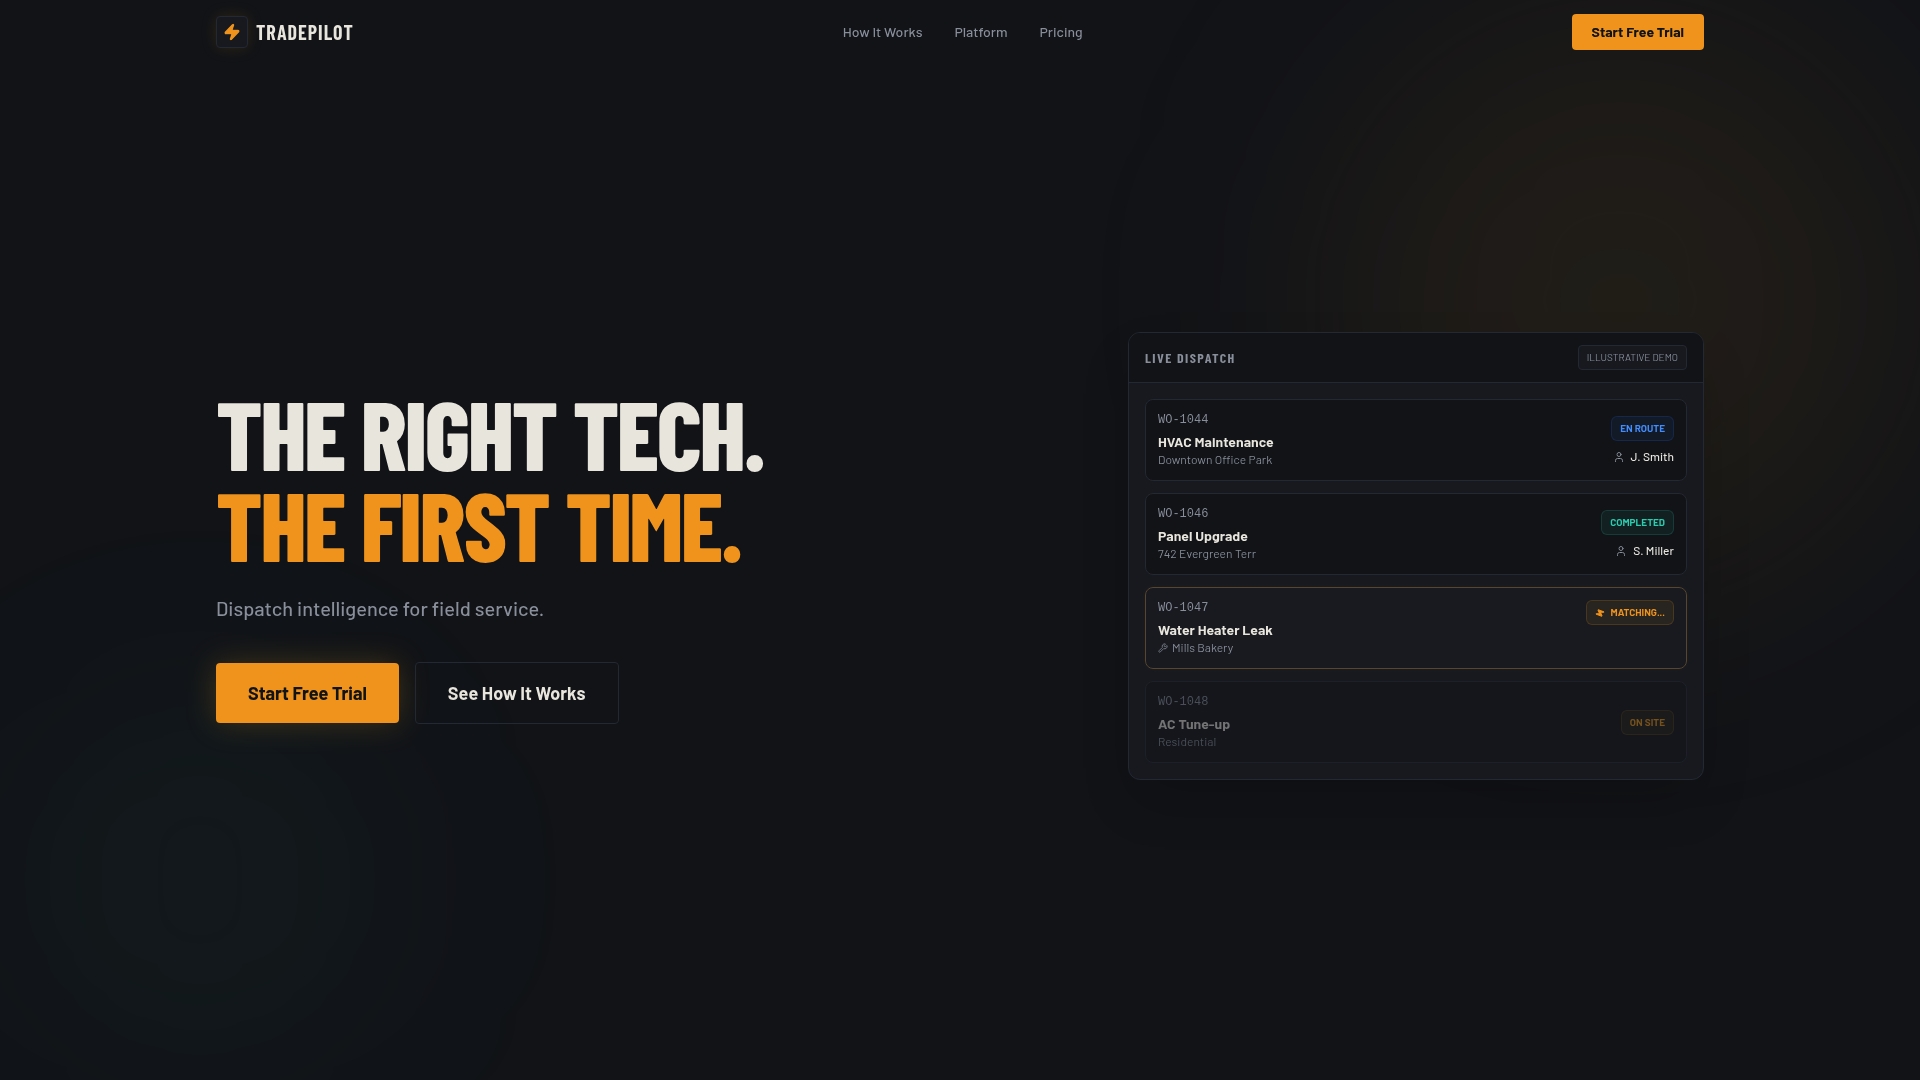
When a reorder point is triggered, Tradepilot can notify the right person instantly, whether that is a purchasing manager or the technician lead. Combined with AI-powered dispatch that matches jobs to technicians by skill and parts availability, you get a system where inventory and scheduling reinforce each other rather than working against each other. No more discovering a part is out of stock after the job is already booked.
See how it works for your operation: start a free trial or book a demo at Tradepilot.