
Schedule adherence measures how closely a technician or agent follows their assigned schedule, minute by minute, in the exact state they're supposed to be in. The formula is simple: Adherence = (Time in scheduled state ÷ Total scheduled time) × 100. Most mature operations target adherence levels generally between 90% and 95%. Levels below 85% suggest significant schedule or process issues. Levels above approximately 97% may indicate overly loose tolerance settings that reduce metric effectiveness.
Managers track this number for three reasons:
- To predict and protect service levels
- To catch staffing shrinkage before it shows up in customer complaints
- To size future schedules more accurately
Key Takeaways
| Point | Details |
|---|---|
| Know the formula | Adherence equals time in scheduled state divided by total scheduled time, times 100. |
| Target the healthy band | Aim for 90% to 95%; investigate scores below 85% and question scores above 97%. |
| Separate adherence from conformance | Use adherence for timing-sensitive coverage and conformance for flexible-output work. |
| Fix intervals, not people | Repeated breaches in the same shift point to schedule design flaws, not individual failure. |
| Automate the fix | Tradepilot's AI dispatch and drag-and-drop rescheduling reduce mismatched assignments that drive non-adherence. |
Table of Contents
- What Is Schedule Adherence and Why Does It Matter?
- How to Calculate Schedule Adherence
- Schedule Adherence vs. Schedule Conformance: What's the Difference?
- What's a Good Schedule Adherence Score?
- How Schedule Adherence Gets Measured in Practice
- Common Causes of Poor Schedule Adherence
- How to Improve Schedule Adherence
- What to Include in Your Adherence Reports
- Adherence Is a Signal, Not a Scorecard
- How Tradepilot Helps You Close Adherence Gaps
- Frequently Asked Questions
- Sources
What Is Schedule Adherence and Why Does It Matter?
Adherence isn't an abstract HR metric. It's the connective tissue between the schedule you built and the coverage your customers actually get. Workforce planners call this the "power of one": when even one technician or agent drifts out of their assigned state during a peak interval, wait times climb and service levels slip in that same window, according to Verint's breakdown of the metric.
The downstream effects compound fast:
- Longer customer wait times when coverage gaps hit during peak call or job volume
- Higher shrinkage as unplanned absences and late starts eat into productive hours
- Burnout and payroll waste when managers overstaff "just in case" instead of trusting the schedule
Pro Tip: Before you use adherence numbers to coach or discipline anyone, use them to audit the schedule itself. A team that's chronically "late" to the same shift, every week, usually isn't undisciplined. The shift is built wrong.
How to Calculate Schedule Adherence
The formula stays the same everywhere: divide the time someone spent in their scheduled state by their total scheduled time, then multiply by 100. Most workforce management systems sample this in 15 or 30 minute intervals rather than checking continuously, a standard interval length Verint documents and one echoed across most WFM platforms. Tolerance windows, typically a few minutes on either side of a shift boundary, decide whether a small deviation counts against the interval or gets absorbed as noise.
Here's a worked example:
- A technician is scheduled for 480 minutes (an 8-hour shift).
- They log 456 minutes in their assigned state, arriving 12 minutes late and taking an extra 12-minute break.
- Adherence = (456 ÷ 480) × 100 = 95%.
That lands right inside the healthy band, even with a rough start.
Schedule Adherence vs. Schedule Conformance: What's the Difference?
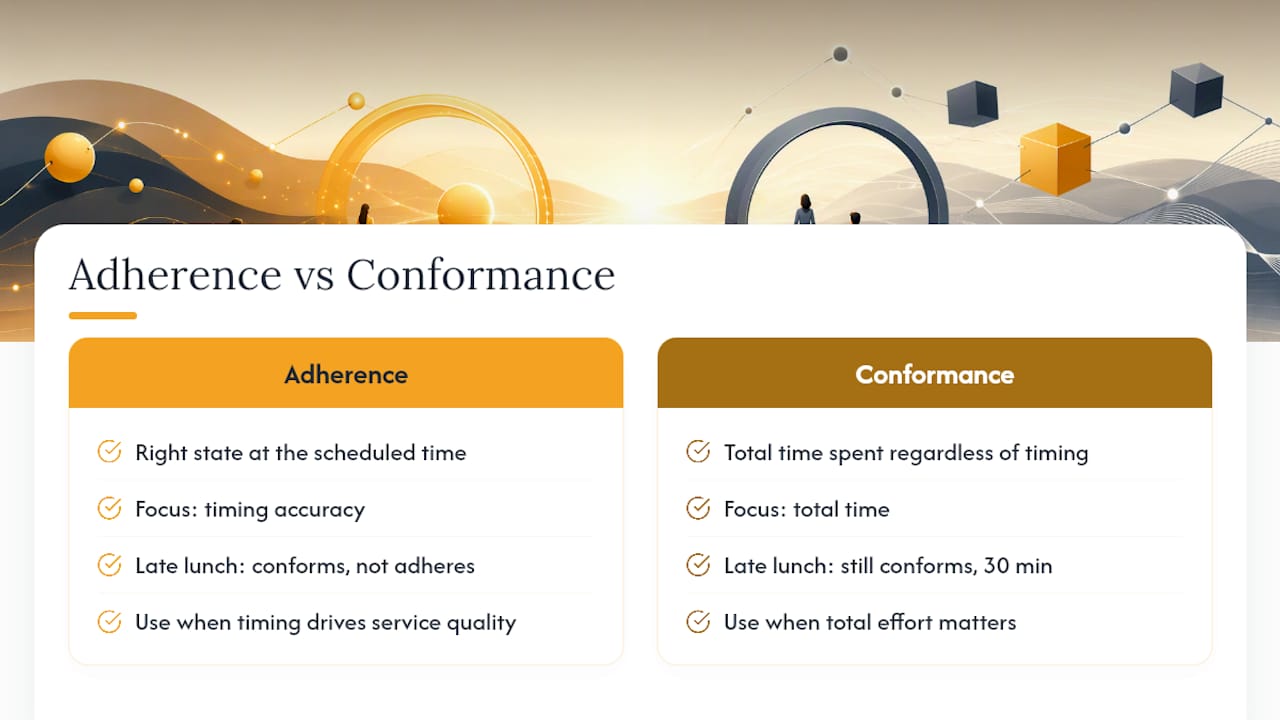
Adherence checks when someone was in the right state. Conformance checks how much total time they spent in it, regardless of timing, a distinction Indeed's career guide lays out clearly. A technician who takes their lunch break an hour late but still takes exactly 30 minutes conforms but doesn't adhere.
Adherence matters more for time-sensitive coverage: call queues, dispatch windows, anything with a customer waiting right now. Conformance matters more for flexible-output work: total billable hours, project completion, tasks without a fixed clock. Pick adherence when timing drives service quality. Pick conformance when total effort is what counts.
What's a Good Schedule Adherence Score?
Below 85% signals a schedule integrity problem, whether that's bad forecasting, unrealistic shift design, or a real behavioral issue.
Over-tightening adherence targets backfires too. Push for near-100% and staff start clocking exact break lengths instead of solving customer problems, which is the perverse-incentive trap the WFM Labs wiki warns against. The sweet spot balances accountability with real flexibility.
- Under 85%: Investigate schedule design and forecasting first
- 90% to 95%: Healthy operating band
- Over 97%: Check whether tolerance settings are too forgiving
How Schedule Adherence Gets Measured in Practice
Real-time adherence dashboards typically refresh every 30 to 60 seconds, showing each technician's or agent's current state against their scheduled state. Most platforms display this as a Gantt-style timeline alongside adherent and non-adherent time totals, features documented in Microsoft's Adherence Tracker guide.
Historical reporting works differently. Vendor systems like Amazon Connect recalculate adherence retroactively when a schedule changes, sometimes reaching back up to 30 days, so a shift swap made today can quietly rewrite last week's numbers.
Common dashboard elements worth configuring:
- Adherence timeline (Gantt view) per person
- Adherent vs. non-adherent time totals
- Per-interval breach highlights with color-coding
- Configurable alert thresholds for trailing-window adherence drops
Pro Tip: Set a small grace window, five minutes or less on login and logout, before flagging non-adherence. Without it, you're penalizing normal human variance instead of catching real drift.
Common Causes of Poor Schedule Adherence
Most adherence problems trace back to one of a handful of root causes:
- Shift design that doesn't match actual demand patterns
- Forecasts that underestimate volume during specific hours
- Back-to-back tasks with no buffer between them
- Sudden queue or job surges that overwhelm the plan
- Recurring lateness tied to shift start times or commute patterns
- Unclear or overlapping schedule states that confuse the system
Run a quick diagnostic before assigning blame: check whether the same interval breaches repeatedly across different people. If it does, that's a schedule-design problem, not an individual performance issue, a pattern the WFM Labs wiki flags as one of the most common measurement mistakes teams make.
How to Improve Schedule Adherence
Fix the fast stuff first, then rebuild what keeps breaking.
Immediate fixes (first 30 days):
- Turn on real-time alerts so supervisors catch drift within minutes, not at end-of-shift review.
- Set tolerance windows that match your operation's actual rhythm, not an arbitrary default.
- Enable rectification workflows so supervisors can correct flagged intervals when the system misreads a legitimate exception.
- Add short buffers between back-to-back tasks instead of scheduling them wall-to-wall.
Structural fixes (next 60 to 90 days):
- Redesign shifts where the same interval breaches repeatedly, rather than coaching the same people every week.
- Pair adherence reports with interval-level reasons, not just the aggregate percentage.
- Test self-scheduling or shift-picking for roles where it's practical. Practitioners at DialPhone note it tends to raise adherence because people choose shifts that fit their lives.
- Integrate desktop or telephony signals so the system captures real state changes instead of relying on manual logging.
Pro Tip: Coach from interval-level evidence, not the aggregate score. Showing them "you were 12 minutes late to your 9:00 AM slot three times this week" gives them something to actually fix.
Owner suggestions for rollout: assign a scheduling lead to configure thresholds and alerts in week one, have supervisors run rectification training in week two, and set a 90-day checkpoint to review which shifts still show repeat breaches.
What to Include in Your Adherence Reports
A useful adherence report goes beyond a single percentage. Track these core metrics:
- Adherence % — the headline number
- Adherent time — total minutes spent correctly in the scheduled state
- Non-adherent time — total minutes spent out of state
- Scheduled time — total planned minutes for the period
- Interval-level breaches — how many individual intervals fell outside tolerance
Segment the data by queue or channel, by shift, by interval, and by individual technician. Queue-level segmentation shows where coverage gaps hit hardest. Interval-level segmentation shows which specific time blocks need redesign, an approach the WFM Labs wiki recommends for feeding the next scheduling cycle rather than just grading last week's performance.
A basic report template needs these columns: Date, Shift, Queue/Channel, Scheduled Time, Adherent Time, Non-Adherent Time, Adherence %, and Breach Count. Fill it weekly and the patterns show up on their own.

Adherence Is a Signal, Not a Scorecard
The biggest mistake we see managers make is treating adherence like a report card instead of a diagnostic tool. A low score doesn't tell you someone is lazy. It tells you something in the schedule, the forecast, or the workflow doesn't match reality. At Tradepilot, adherence data feeds directly into how shifts and jobs get matched to technicians in the first place, because the best fix for chronic drift usually isn't a stern conversation. It's a better schedule.
How Tradepilot Helps You Close Adherence Gaps
Fixing adherence usually means fixing the schedule before you fix the person. Tradepilot's AI matches every job to the best-fit technician by skill, availability, and location in under a second, which cuts down the mismatched assignments that cause late starts and back-to-back overload in the first place.
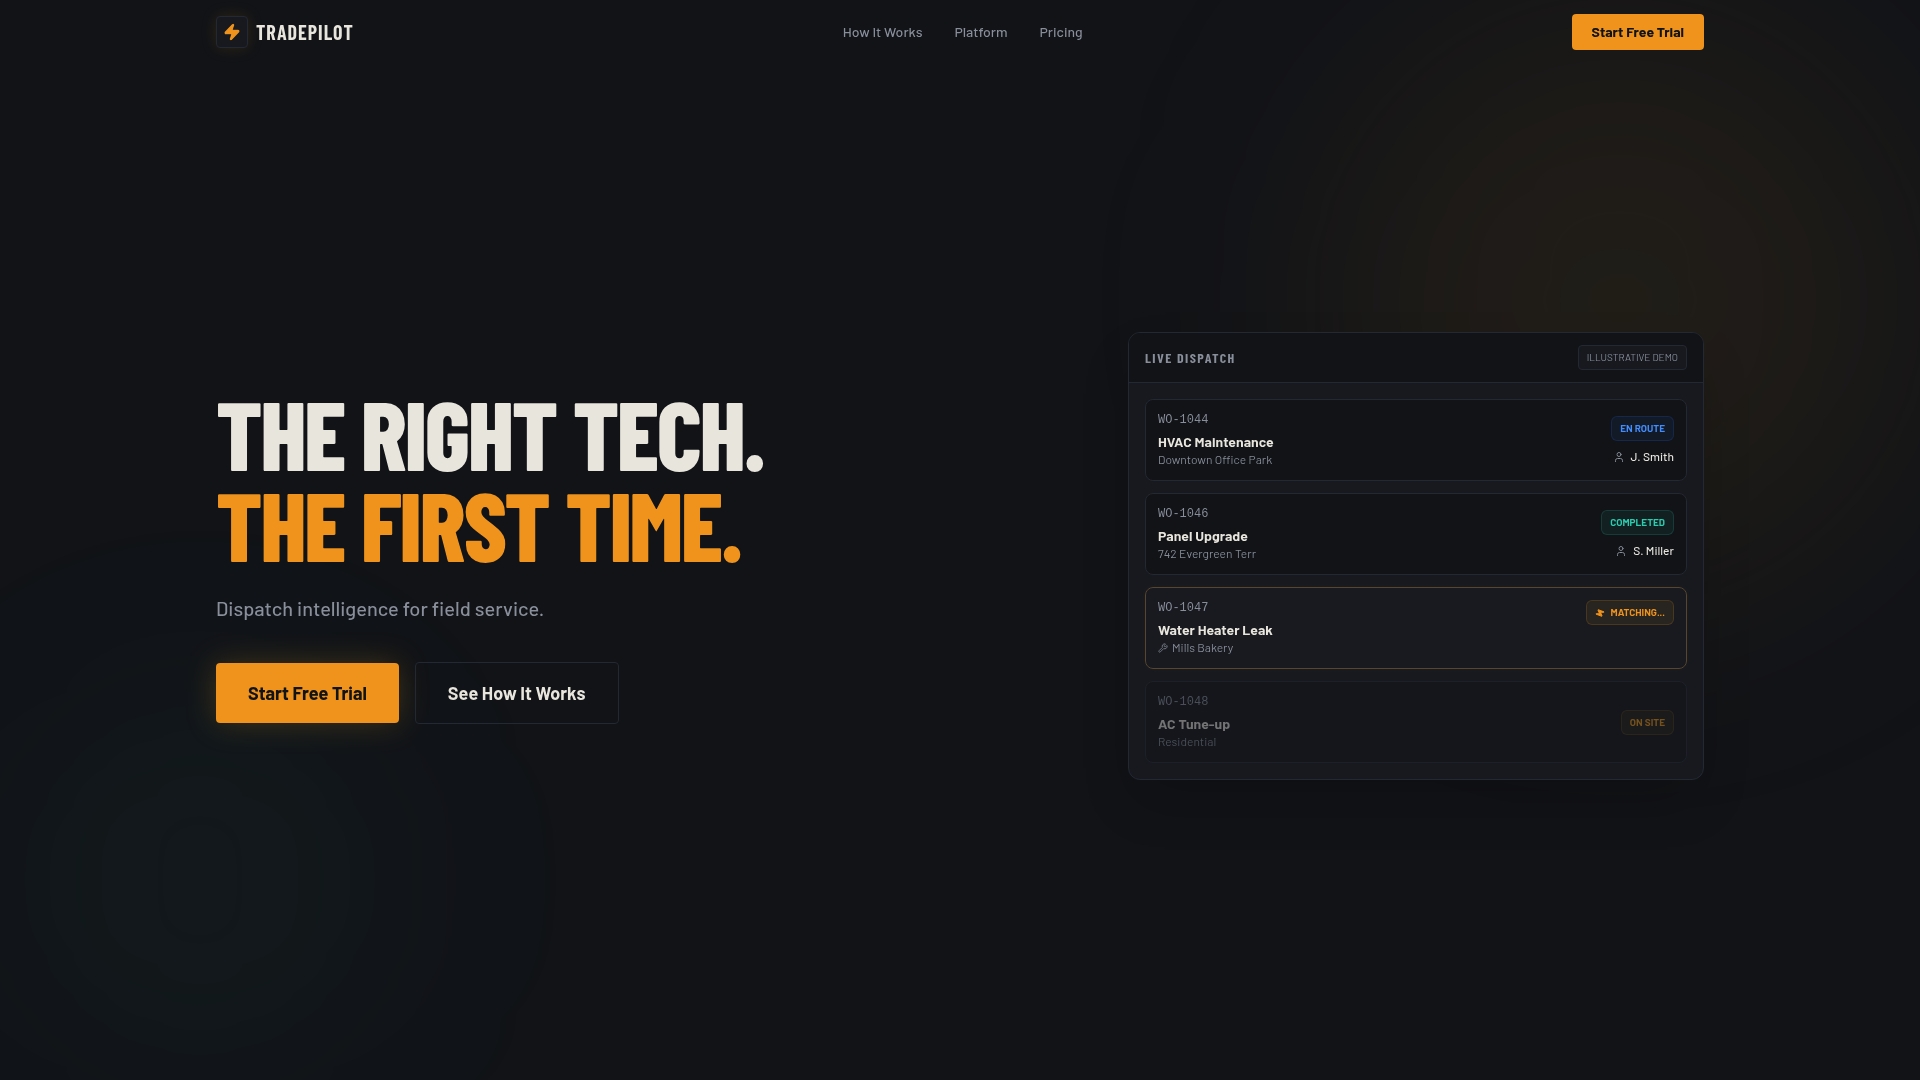
When plans change mid-day, drag-and-drop scheduling lets dispatchers rebalance jobs in seconds instead of waiting for the next shift to absorb the fallout. Built-in analytics track adherent versus non-adherent time automatically, so you're not building spreadsheets to find the shifts that keep breaking. If you're planning your next scheduling cycle around what the data is telling you, our guide to AI-driven field service scheduling walks through how that feedback loop works in practice. Start a free trial or talk to sales through the Tradepilot platform and see what your dispatch data actually reveals about your schedule.
Frequently Asked Questions
What is a good schedule adherence percentage?
How is schedule adherence calculated? Divide the time someone spent in their correctly scheduled state by their total scheduled time, then multiply by 100. Most systems sample this in 15 or 30 minute intervals.
What's the difference between schedule adherence and schedule conformance? Adherence tracks timing, whether someone was in the right state at the right moment. Conformance tracks total time spent in an activity regardless of when it happened.
Why is my team's schedule adherence low? Low adherence usually traces back to unrealistic shift design, inaccurate forecasting, back-to-back tasks with no buffer, or unclear schedule states, more often than individual performance issues.
How often should adherence dashboards refresh? Real-time dashboards typically refresh every 30 to 60 seconds, giving supervisors enough lead time to catch drift and act before it affects service levels.